
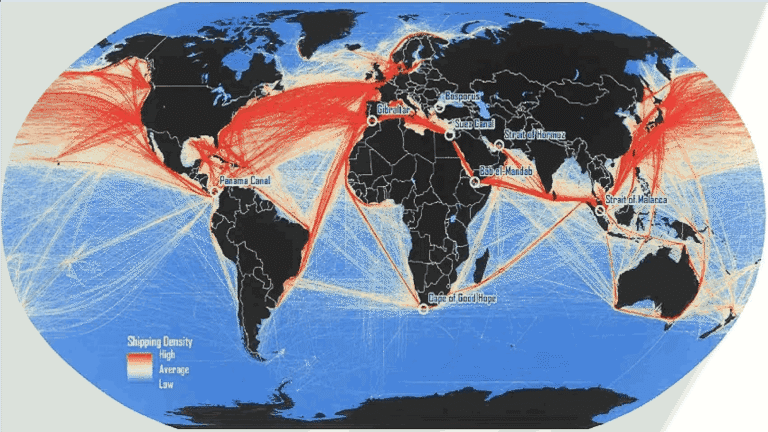
A Deep Dive into the World’s Busiest Shipping Routes
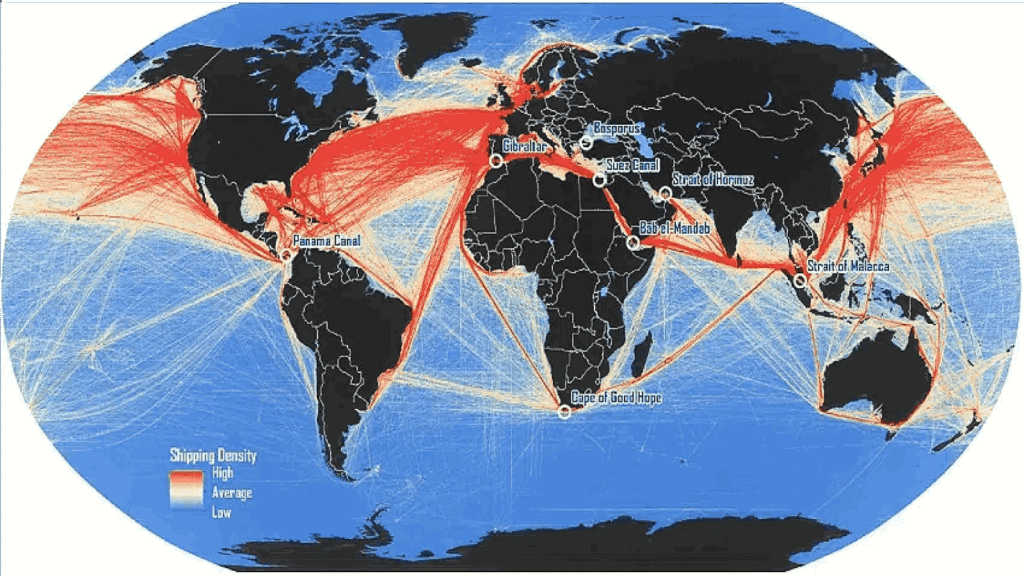
The dense red lines crisscrossing the world’s oceans on maritime traffic maps tell a story of global interdependence. These concentrated shipping lanes, particularly at strategic chokepoints, serve as the circulatory system of international trade, moving trillions of dollars in goods annually. In 2024, these narrow passages handled unprecedented volumes of cargo, demonstrating both their critical importance and growing vulnerability to disruption.
The Strait of Malacca: The World’s Busiest Maritime Gateway
Stretching approximately 800 kilometers between Indonesia’s Sumatra Island and the Malay Peninsula, the Strait of Malacca stands as the world’s most critical shipping chokepoint. In 2024, this narrow waterway reached an all-time high of 94,301 vessel transits, representing a significant 5.5% increase from the previous year. At its narrowest point in the Phillips Channel near Singapore, the strait shrinks to just 1.96 nautical miles wide, creating a natural bottleneck for global commerce.
The economic significance of this passage cannot be overstated. The strait facilitates approximately $3.5 trillion in annual trade, carrying about 30% of all globally traded goods. This includes two-thirds of China’s maritime trade volume, 40% of Japan’s maritime commerce, and one-third of worldwide trade. In 2023, the strait transported around 23.7 million barrels of oil per day, surpassing even the Strait of Hormuz as the world’s largest oil transit route.
For China specifically, the Malacca Strait represents a strategic vulnerability known as the “Malacca dilemma.” Roughly 80% of China’s oil imports traverse these waters, accounting for 60% of the nation’s entire oil supply. The concentration of such critical resources through a single passage has prompted Beijing to explore alternative routes, though none offer the same efficiency or cost-effectiveness.
The strait operates near capacity with approximately 210 commercial ships transiting daily. Maritime experts predict it will exceed its operational capacity by the end of the decade if current growth rates continue. Already prone to congestion and collisions, the passage faces mounting pressure from increasing vessel sizes and trade volumes. Between February and April 2024, container shipping rates from China surged 88%, partly due to delays and congestion in this crucial waterway.
The Suez Canal: Europe’s Gateway to Asia
Connecting the Mediterranean Sea with the Red Sea, the Suez Canal serves as one of humanity’s most ambitious engineering achievements and a vital shortcut for international trade. This 190-kilometer artificial waterway handles approximately 12% of total global trade, with roughly 30% of the world’s shipping container volume passing through its waters annually.
However, 2024 proved to be an extraordinarily challenging year for the canal. Following Houthi militia attacks on commercial vessels in the Red Sea beginning in late 2023, traffic through the Suez Canal plummeted dramatically.
The number of vessels transiting the canal in May 2024 fell to just 1,111 ships, down from 2,396 during the same period in 2023. Cargo volume experienced an even sharper decline, dropping 68.5% to about 44.9 million tons compared to 142.9 million tons in May 2023. From 2020 to 2023, the canal averaged nearly 1.6 billion tons of cargo annually under normal operations, with over 20,000 vessels passing through each year.
The disruption forced many shipping companies to reroute vessels around the Cape of Good Hope, adding more than 10 days to journey times and substantially increasing costs. The volume of crude oil and oil products flowing around the Cape of Good Hope increased to 9.2 million barrels per day in the first eight months of 2024, up from an average of 6.0 million barrels per day in 2023.
In 2021 and 2022, before the crisis, the Suez Canal achieved record revenues of approximately $7 billion annually, highlighting the significant economic impact of the 2024 disruptions. The Egyptian government has extended fee discounts of up to 75% for certain vessel categories in an attempt to restore competitiveness and encourage shipping lines to return to the canal route.
The Panama Canal: Bridging Two Oceans
The Panama Canal, connecting the Atlantic and Pacific Oceans across Central America, represents another critical node in the global shipping network. In fiscal year 2024, the canal handled 210.3 million long tons of cargo across 11,240 transits of deep-draft and small commercial vessels, generating $3.381 billion in toll revenues.
However, 2024 was marked by significant challenges. The canal experienced its worst drought in history, which began in late 2022 and peaked in early 2024. The Panama Canal Authority reported a 29% drop in vessel transits during fiscal year 2024 compared to the previous year, with LNG and dry bulk shipments experiencing the most severe impacts.
Despite these challenges, approximately 76% of the tonnage handled by the Panama Canal involves American origins or destinations. The most significant trade route serviced by the canal connects Asia to the U.S. East Coast, accounting for 48.4% of total tonnage, followed by the West Coast South America to U.S. East Coast route at 13.9%.
The canal moves approximately $270 billion worth of cargo annually, with the United States using it to export 125.6 million long tons to Asian markets in 2023, while importing 61.1 million long tons, primarily from Asia. By late 2024, the canal began recovering, with authorities implementing new booking systems and planning potential dam projects to improve water management for future drought resilience.
The Strait of Hormuz: The World’s Oil Artery
Positioned between Iran and Oman, the Strait of Hormuz connects the Persian Gulf with the Gulf of Oman and serves as the world’s most important oil transit chokepoint. In 2024, oil flow through the strait averaged 20 million barrels per day, equivalent to approximately 20% of global petroleum liquids consumption.
More than 30,000 vessels pass through the Strait of Hormuz annually, with the passage accounting for about 80% of the Persian Gulf region’s oil exports. The strait is deep and wide enough to handle the world’s largest crude oil tankers, making it irreplaceable for Middle Eastern oil exports.
The energy value flowing through this chokepoint is staggering. At 2024 oil prices averaging around $80 per barrel, the 20 million barrels per day represents approximately $1.6 billion worth of oil passing through the strait daily, or roughly $584 billion annually. Additionally, around one-fifth of global liquefied natural gas trade also transited the Strait of Hormuz in 2024, primarily from Qatar.
China, India, Japan, and South Korea are the top destination markets for crude oil moving through Hormuz, accounting for approximately 69% of all Hormuz crude oil and condensate flows in 2024. An estimated 84% of the crude oil and condensate that moved through the strait went to Asian markets, making these economies particularly vulnerable to any disruption.
Between 2022 and 2024, volumes of crude oil and condensate transiting the Strait of Hormuz declined by 1.6 million barrels per day, partially reflecting OPEC+ voluntary production cuts and Saudi Arabia’s strategic shift to use alternative pipeline routes during Red Sea tensions. Only Saudi Arabia and the United Arab Emirates have operational pipelines that can partially circumvent the Strait of Hormuz, with Saudi Arabia’s East-West pipeline having a capacity of 5 million barrels per day and the UAE’s pipeline to Fujairah capable of handling 1.8 million barrels per day.
The Broader Picture: A $33 Trillion Global Trading System
These chokepoints operate within a broader global trading system that reached a record $33 trillion in value in 2024, growing by 3.7% over the previous year. Approximately 80% of global trade by volume and 70% by value is transported by sea, with 60% of maritime trade passing through Asia.
Global seaborne trade volumes grew by 2.4% in 2024 to reach 12.6 billion tons, but the standout metric was the 6.2% increase in tonne-miles—the largest growth in shipping demand in 15 years. This increase was driven largely by Red Sea rerouting, which added approximately 700 vessels sailing around the Cape of Good Hope, effectively increasing demand by about 12%.
The world fleet grew by just 3.4% to 2.4 billion deadweight tons in 2024, with wide variations across vessel types. The container fleet expanded by 10.1% while the tanker fleet grew by only 0.8%. The value of the world fleet and orderbook has reached $2.0 trillion, up from $1.2 trillion in 2020.
The Vulnerability of Vital Passages
The concentration of global trade through these narrow passages creates significant vulnerabilities. Any disruption—whether from military conflict, piracy, accidents, natural disasters, or political tensions—can immediately impact global supply chains and commodity prices. The 2024 experience demonstrated this dramatically, with Red Sea attacks forcing wholesale rerouting and the Panama drought constraining capacity.
For businesses operating in international markets, understanding these chokepoints is no longer optional. The automotive sector, which relies heavily on just-in-time delivery of components through the Strait of Malacca, experienced firsthand how delays can stall entire factories. Electronics manufacturers faced similar challenges as shipments from East Asian production hubs encountered congestion and rerouting.
The strategic importance of these passages extends beyond economics into geopolitics. Control or disruption of any major chokepoint represents significant leverage in international relations. China’s investments in alternative routes to avoid the Malacca Strait, the United States’ interest in maintaining freedom of navigation through the Strait of Hormuz, and Egypt’s dependence on Suez Canal revenues all illustrate how maritime geography shapes global politics.
Looking Forward: Adaptation and Resilience
As global trade continues to expand and vessel sizes increase, pressure on these vital passages will only intensify. The shipping industry is responding with technological innovations including improved cargo tracking, predictive analytics, and more efficient vessel designs. Companies are also reassessing and diversifying their supply chains, exploring new partnerships and routes to mitigate potential risks.
Thailand has proposed a 100-kilometer “landbridge” at the narrowest part of the Malay Peninsula, where goods could be offloaded and transported by rail and road to avoid the Strait of Malacca entirely. While ambitious, such projects highlight the urgent need for alternative solutions as existing chokepoints approach capacity limits.
The Panama Canal is moving forward with plans for potential dam construction to improve water security, while implementing sophisticated booking systems to optimize vessel scheduling. The Suez Canal Authority continues to offer incentives to restore traffic levels following the Red Sea crisis.
Conclusion
These narrow passages, marked in red on global shipping maps, represent far more than geographic bottlenecks. They are the arteries through which the lifeblood of modern commerce flows—carrying everything from the crude oil that powers economies to the consumer goods that stock store shelves. In 2024, they moved trillions of dollars in cargo despite facing unprecedented challenges, demonstrating both their resilience and their irreplaceable role in connecting the world’s markets. As we look toward 2025 and beyond, ensuring the security and capacity of these vital passages will remain one of the most critical challenges facing the global economy.