

The Map at a Glance
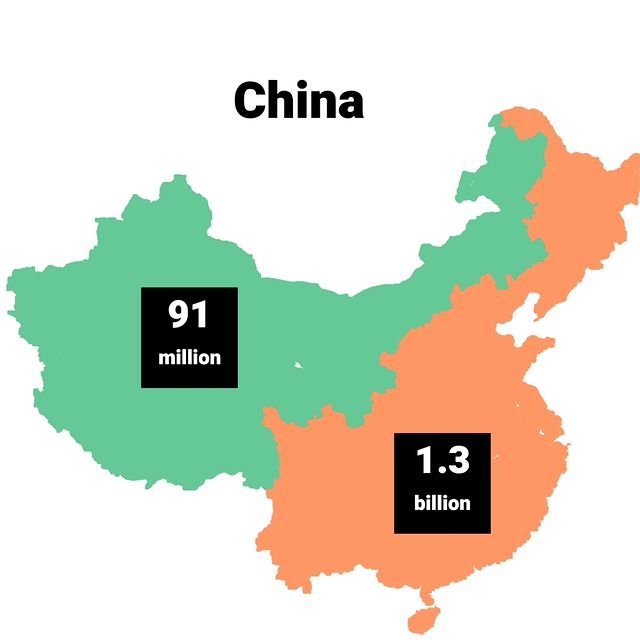
The map in question divides China into two broad regions, using a combination of color and numerical data to convey population distribution:
Northwest Region: Highlighted in green, this part of China is shown to have a population of 91 million. This region encompasses the vast, often arid and mountainous areas including parts of the Tibetan Plateau, the Gobi Desert, and the Xinjiang Uyghur Autonomous Region.
Eastern Region: Marked in orange, this area is significantly more populated, with a staggering 1.3 billion people. This part of China includes the fertile plains, major river systems like the Yellow and Yangtze Rivers, and the bustling eastern seaboard where cities like Beijing, Shanghai, and Guangzhou thrive.
Why Such a Disparity?
The stark contrast between these two regions isn’t just a random occurrence; it’s deeply rooted in geographical, historical, and socio-economic factors:
Geographical Factors: The eastern part of China benefits from a more temperate climate, fertile soil, and abundant water resources due to the presence of major rivers. This has historically made it more suitable for agriculture and settlement. In contrast, the northwest is characterized by harsh climates, deserts, and high altitudes, which limit habitability.
Historical Development: China’s historical development, including the rise of ancient civilizations like the Shang and Zhou in the east, has led to a concentration of cultural, political, and economic power in this region. Over centuries, this has attracted more people to settle here, creating a self-reinforcing cycle of population growth.
Economic Opportunities: Today, the eastern region is the economic powerhouse of China, hosting major industrial zones, technology hubs, and trade ports. This economic dynamism attracts both domestic and international migrants seeking employment and better living conditions, further increasing its population density.
Implications of Population Distribution
This population map is not just a static representation; it has profound implications for various aspects of Chinese society and policy:
Urbanization and Infrastructure: The eastern region’s high population density necessitates extensive urban planning, infrastructure development, and public services. Cities here face challenges like traffic congestion, pollution, and housing shortages, pushing for innovative solutions in sustainable urban development.
Regional Disparities: The disparity shown in the map highlights the regional economic and developmental differences within China. Government policies like the Western Development Strategy aim to bridge this gap by investing in infrastructure, education, and economic development in less populated areas.
Environmental Impact: With such a large population concentrated in a smaller area, environmental sustainability becomes critical. Issues like water scarcity, air quality, and land degradation are more pronounced in the east, requiring stringent environmental policies.
Cultural and Social Dynamics: Population distribution affects cultural preservation, with the less populated west often being home to diverse ethnic minorities with unique traditions. Balancing modernization with cultural preservation is a delicate task in these regions.
Looking Forward
As China continues to evolve, this map serves as a reminder of the ongoing challenges and opportunities in managing such a vast and diverse population. The government’s focus on balanced regional development, the Belt and Road Initiative’s impact on western regions, and the push towards technological innovation for urban management are all responses to the patterns depicted in this map.
In conclusion, this population map from Epic Maps provides not just a visual representation but a narrative of China’s demographic story. It’s a story of contrast, challenge, and change, reflecting how geography shapes human settlement and national policy. As we look to the future, understanding these patterns will be crucial for anyone interested in China’s development trajectory.