
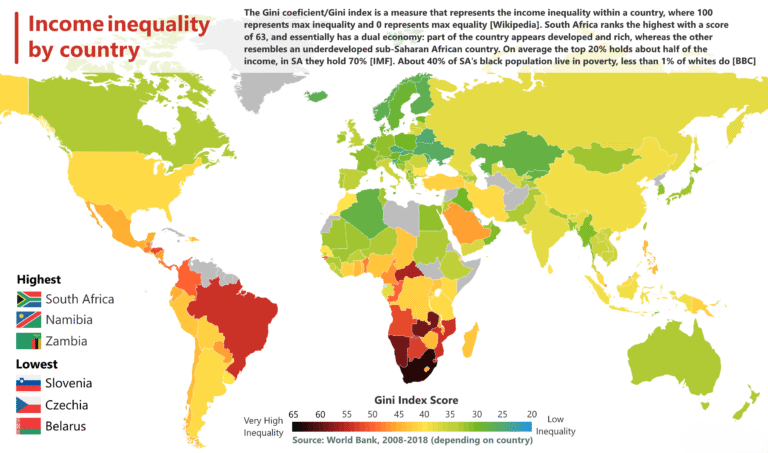

The map shown here presents a world map color-coded by the Gini index to illustrate income inequality by country. The Gini index here shows us that 100 indicates maximum inequality and 0 maximum equality. The data is sourced from World Bank. Countries with the highest inequality include South Africa, Namibia, and Zambia, while Slovenia, Czechia, and Belarus show the lowest inequality.
In region of Africa, income inequality is pronounced highly, especially in south Africa. South Africa has the highest Gini index score around 63, that reflects a stark divide between a wealthier developed segment and a poorer underdeveloped population. Neighboring countries like Namibia and Zambia also rank among the top in the continent. Central and western Africa show varying inequality levels, but many countries experience moderate to high disparity. Several countries here are uncolored, indicating us a lack of data.
In South America, this continent experiences significant inequality, most notably Brazil with a high Gini score. Other big countries from central America like Chille and Argentina also show moderate to high inequality.
North America shows a gradient Gini score of mostly lower inequality. Canada has the lowest inequality while USA have significant income inequality and Mexico tops the continent in the Gini score.
Europe generally displays lower inequality levels as many countries have the low to moderate range of Gini score. The lowest income inequality is seen in Slovenia, Czechia, and Belarus. Western and Northern European countries lean towards lower inequality scores compared to Eastern Europe, which shows slightly higher disparities but still much less severe than in Africa or parts of the Americas.
Asia presents a very mixed picture, with Northern and Central countries displaying moderate inequality. Countries like India, Pakistan and Bangladesh from South Asia and Southeast Asia have varied levels, generally moderate but often above the low inequality range.
East Asia, including China and Japan, tend towards moderate inequality. Several countries lack sufficient data for assessment and study. Where South Korea have high income inequality.
Australia and its other neighboring island nations, shows relatively low-income inequality, similar to many European countries. This region has been different by more equitable income distribution compared to Africa and the Americas.
Overall, the map highlights distinct regional disparities in income inequality worldwide, with African countries exhibiting the highest inequality, followed by parts of Latin America and moderate levels in Asia, Europe, and Oceania. The visualization underscores the complexity of economic inequality and the socio-economic challenges faced in various global regions.
At the end Income Equality is a very big national problem that all countries fight on its own. Every government of every country is continuedly trying to achieve lower inequality for the bright future of its people.