Epic Map

Epic Map

DESPITE GENOSIDE, ARMENIANS UNITED TO FORGE A NEW COUNTRY.

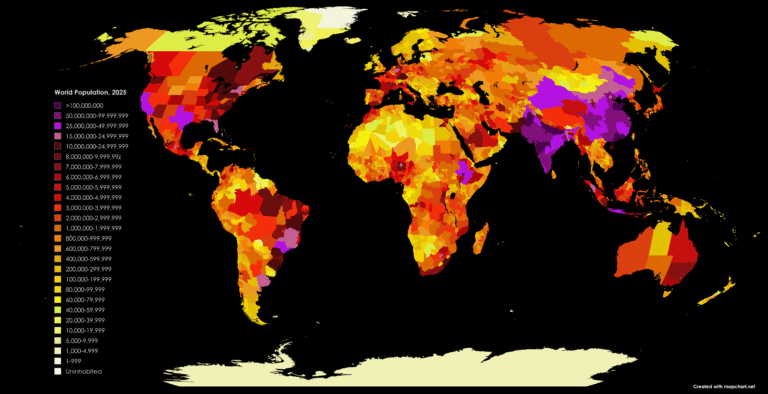
POPULATION DENSITY COMPARISON OF ARMENIA The provided map shows the dramatic centering and contraction of the Armenian population from 1914 to 2023. In 1914, Armenians were extensively distributed across Eastern Turkey, the South Caucasus, and regions surrounding Lake Van, Lake…

NO ONE REALLY CARES ABOUT GENDER EQUALITY.

GENDER EQUALITY WORLD MAP The Gender Inequality Index (GII) map for 2023 visually compares countries by gender disparities in reproductive health, empowerment, and economic status. Scores range from 0 to 1, revealing stark contrasts between regions. Below is a continent-wise…

THE MORE ENERGY COUNTRY USES THE MORE CARBON IT GENERATES.

GLOBAL CARBON EMISSIONS MAP This global map shows us annual carbon emissions from land areas, differentiating regions by the intensity of emissions. The pattern across continents highlights a clear link between economic development, urbanization, and population density with carbon outputs.…

US Population Statistics Has To Be Worse Now.

POPULATION OF BLACK IN USA BY COUNTY. The map displays the percentage of Black population by county across the United States, illustrating highly uneven distribution patterns. Counties in the Southeast—especially those in Mississippi, Alabama, Georgia, South Carolina, and Louisiana—stand out…

65% OF PEOPLE CAN’T SAY THE TRUTH IN 2025

INTERNET CENSORSHIP AND FREEDOM OF SPEECH MAP The map shows us the current situation about freedom of speech globally, using color codes to indicate the amount of restriction: dark green for “open,” light green for “less restricted,” yellow for “restricted,”…

THE MORE PROSPEROUS THE LAND IS, THE MORE DANGEROUS.

WORLD MAP OF AIR QUALITY AND POLLUTION LEVEL This map visually shows us global air pollution levels, with color intensity indicating higher degrees of pollution—red and dark orange signifying the most polluted regions, yellow indicating moderate pollution, and green for…

THE MORE BEAUTIFUL THE NATION, THE MORE IT SUFFERS.

MAP OF NATURAL DISASTER RISK AND ECONOMIC LOSS IMPCAT Natural disasters are unpredictable and impossible for humans to be safe of. This map shows the economic loss risk distribution of global hazards by natural disasters. The given map is created…

DEVELOPING COUNTRIES ARE MUCH BETTER FOR WOMAN.

This map, sourced from the UNODC, shows rape rates per 100,000 citizens by country. This map is created using color gradations from pale yellow (low rates) to deep red (high rates) for the period of 2010-2012. Below are a concise…

ONE THIRD OF THE WORLD IS STILL ILLITERATE.

GLOBAL MAP OF LITERACY RATE IN 2025. Education is the first and most basic necessity of human life that is needed to live a great life. Without education humans are unable to write or read any language. And if they will…

WORLD POPULATION DENSITY MAP IN 2025

Nations only become powerful when they have enough Population. The numbers of populations change very dramatically over a long period of time. Population depends on the nation’s cultural values, on prosperity, on different pandemic and on the wars that occurred…