

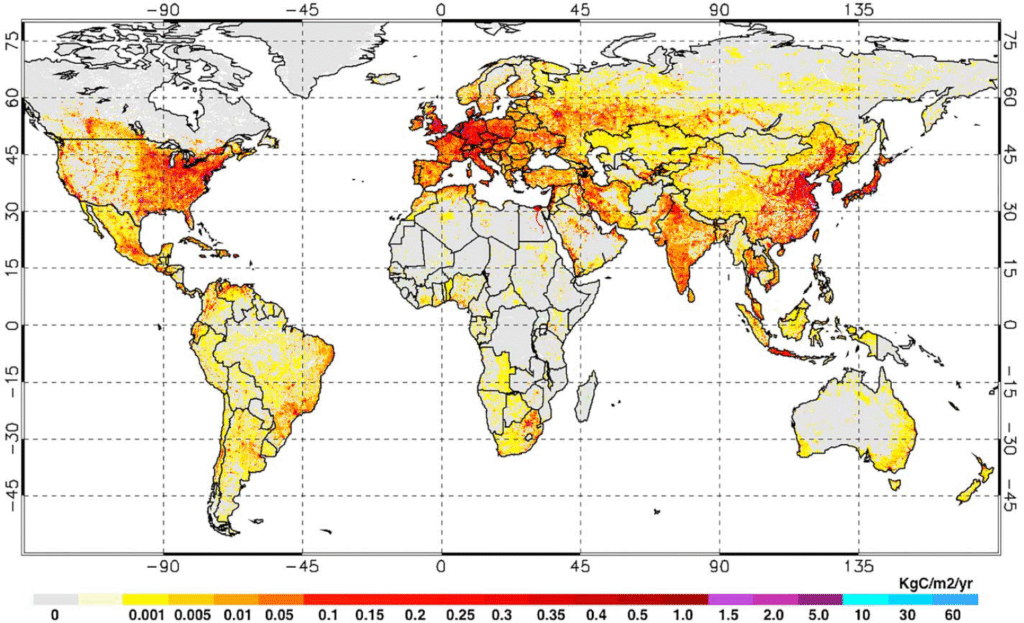
GLOBAL CARBON EMISSIONS MAP
This global map shows us annual carbon emissions from land areas, differentiating regions by the intensity of emissions. The pattern across continents highlights a clear link between economic development, urbanization, and population density with carbon outputs.
NORTH AMERICA
North America, notably the eastern United States and southern Canada, exhibits pronounced carbon emission hotspots. Much of the dense red coloring surrounds major metropolitan areas, industrial corridors, and urban sprawl zones. The northeastern U.S., the Midwest, and California are particularly prominent. The high emissions here are closely associated with widespread energy consumption, transportation networks, manufacturing, and affluent lifestyles. Economic development and high population density translate directly into significant fossil fuel use, contributing substantially to regional carbon emissions.
SOUTH AMERICA
In South America, emissions cluster along the southeastern coast of Brazil—the location of major cities like São Paulo and Rio de Janeiro. These regions demonstrate the direct impact of urban concentration and industry. Although large stretches of the continent show lower emissions, agriculture and land-use changes near the Andes and Brazilian Plateau are detectable, but not as intense. Less economically advanced areas, such as the Amazon basin, have minimal emissions unless affected by deforestation and burning, showing the relationship between human activity and carbon output.
EUROPE
Europe displays some of the world’s most saturated red regions, especially across Western and Central Europe. Countries like Germany, France, the UK, Belgium, and northern Italy stand out as dense clusters of carbon emissions. This visual intensity correlates with the continent’s high population density, advanced industrialization, and highly developed infrastructure. Economic prosperity in Western Europe is synonymous with elevated energy needs and consumption, underpinning greater emissions. Eastern Europe also reveals moderate carbon outputs due to more dispersed population centers and the legacy of heavy industry.
AFRICA
Africa predominantly shows lighter yellow to grey hues, indicating relatively low carbon emissions across most regions. The largest exceptions are found in South Africa—with high values around Johannesburg and Cape Town—and parts of North Africa including Egypt’s Nile Delta. Sparse emissions elsewhere reflect lower industrialization and a predominantly rural population base. However, urban growth in certain regions is associated with increased carbon output. The map reveals a strong divide between developing and developed areas in terms of emission intensity.
ASIA
Asia features complex emission patterns, mostly concentrated in densely populated and economically developed areas. Eastern China, northern India, the Korean peninsula, and coastal Japan are significant hotspots, depicted in deep red. These regions combine massive population densities with fast-paced economic growth and industrialization, making them leading contributors to global carbon emissions. Southeast Asia also shows strong signals around metropolitan areas, though less so when compared to China and India. Economic development and urbanization are visually tied to heightened carbon output in this continent.
AUSTRALIA AND OCEANIA
Australia has moderate emissions centered on major metropolitan zones such as Sydney and Melbourne. The remainder of the continent reflects minimal values, corresponding with low population density and limited industrial development outside urban cores. Oceania, including island nations, is largely absent of major emissions, indicative of both lower economic development and smaller populations.
CONCLUSION
The map provides a vivid spatial demonstration of how economic development and mass human settlement intensify carbon emissions. Regions with thriving economies and dense population concentrations—Europe, eastern Asia, and North America—outpace less developed or sparsely populated areas by a considerable margin. Urbanization, transportation, manufacturing, and high energy demand drive carbon outputs in these zones. In contrast, developing regions and areas with limited economic infrastructure show far lower annual emissions, underscoring the central role of industrialization and population in global carbon cycles. As economies grow and populations concentrate, mitigation of carbon output requires strategic planning in energy, transportation, and urban development to address the direct link illustrated by this map.